Healthcare Venture Capital

Healthcare M&A: Keep Calm and Carry On

In healthcare on June 8, 2012 at 7:28 am

With just a couple of weeks to go until we hear from the Supreme Court on the fate of Health Reform, bankers and the investment community are making grand pronouncements that M&A activity is “on hold” until the Court opines.

This is just not true as you will see below.

Here’s an excerpt with an evocative title from PEHub’s coverage of the annual Jeffries Healthcare Conference just this week (emphasis added):

PE-Backed Healthcare M&A on Hold for Election, Supreme Court Decision on Obamacare

Private equity investing in healthcare is on pause this year, according to executives speaking Wednesday on the panel “Financial Sponsors Perspectives on Healthcare Investing.” The industry is waiting to see whether Mitt Romney succeeds in overtaking President Obama. Also, dealmakers wants some clarity on President Obama’s healthcare reform bill….
Healthcare M&A has slowed this year. So far there have been 1,073 global announced M&A deals, valued at $75.3 billion. This compares to 2,729 deals in all of 2011 which totaled roughly $229.6 billion….

“Once we get clarity, and past Obamacare and the presidential election, we will see more deals,” the exec said.

The problem with this is that it might make for good reading or for an “entertaining” panel discussion at an investment banking conference, but it doesn’t reflect reality.

For starters, M&A activity in healthcare is occurring at breakneck speed from my perch.  To be anecdotal about it, in the past 2 weeks alone, we have seen huge healthcare acquisitions both VC/PE backed and otherwise:

-Ascend Health ($517M)
-Healthcare Partners ($4.7B)
-Extend Health ($435M)
-Catalyst Health Solutions ($4.4B)
-etc

To look at it numerically, I made a quick spreadsheet using Capital IQ data of YTD 2012 vs. YTD same period 2011 for healthcare M&A announced value >$150M for US companies.

2011 Jan 1 to Jun 7: 55 announced acquisitions

vs.

2012 YTD: 49 announced acquisitions

That’s 6 fewer deals this year than last year – hardly an industry “on hold” waiting for the high court.

Prior to Supreme Court oral arguments (started March 26, 2012), the conventional wisdom was that the law had a very good chance of being upheld. So I looked at the post-oral argument “fear period” deal count in 2012 vs. the post-March 26th activity in 2011.

2011 March 26 to Jun 7: 21 announced acquisitions

vs.

2012 March 26 to Jun 7: 26 announced acquisitions

Deal activity is actually up in a very relevant time period for 2012 vs. 2011 – at a time when fear in the current year is supposedly so high. So much for the “healthcare reform bogeyman.”

Finally, the analysis mentioned in the article and at the Jeffries conference looked at global deal activity.  Are Brazilian companies really scared of US healthcare reform when looking to buy other Brazilian companies? No – highly unlikely given how domestic a business healthcare tends to be outside of large pharma.

The explanation could just be that global economic activity has slowed since last year and that EU uncertainty coupled with a possible Chinese growth slowdown has depressed the global numbers quoted at Jeffries.

As with all things healthcare, there’s always a bogeyman that scares the casual observer.  In fact, the nuance and detail matter a lot – especially in healthcare. And nuance and detail is very hard to convey to casual observers.

So for now, my advice is to do as the Brits do: Keep Calm and Carry On.

When It Comes to Venture Funds, Small Is Still Beautiful

In healthcare on January 19, 2012 at 3:51 pm

Over the years, there have been several excellent analyses of the ideal fund size for a venture capital fund.

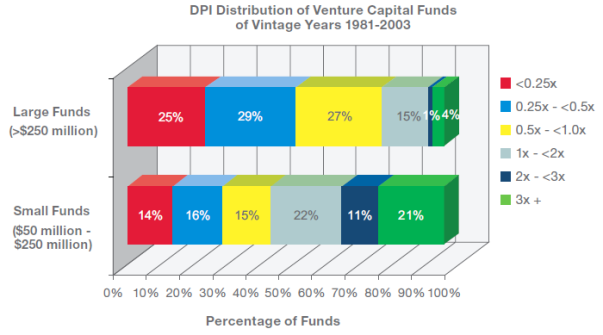
The work that stands out the most is a detailed study in 2010 by the folks at Silicon Valley Bank -in which they found that sub-$250M funds signifigantly outperform their larger brethren.  This piece is a must-read.

They looked at 850 funds and found that only 5% of funds over $250M have ever distributed greater than >2.0x capital  (so-called DPI) to their Limited Partners. That is a pathetic statistic for the venture industry.

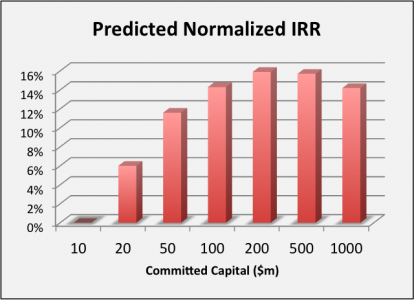
The brain-trust at HBS (Felda & Josh Lerner) came up with similar data that shows that the optimal fund size is $200M or so (credit to Todd Hixon of New Atlantic for the graphic):

There is alot of wisdom in these data sets gathered over 30 years of venture returns.

…which is why it is so odd that 2011 was the year of the return of mega-fund.

Mega is Back – But Is This Time Different?

According to the NVCA, $18B was raised by VC funds in 2011 – a seemingly great headline number – up 32% over 2010.

But what belies that number is a jaw-dropping number of firms raising mega-funds in the past year or so:

1) Bessemer $1.6 billion

2) Accel (growth + early): $1.35 billion

3) Sequoia  $1.3 billion

4) J.P. Morgan Digital Growth $1.2 billion

5) Khosla (growth + early) $1.05 billion

6) Greylock (growth + early) $1 billion

7) Kleiner Digital Growth $1 billion

Only three things can explain this:

1) LP’s have gone mad

2) Returns of large funds have fundamentally changed since the SVB and HBS data sets

3) We are in the midst of another period / trend in VC that might again end badly

Part of this rush to mega-funds is clearly driven by the strong later stage (but still largely paper) returns that many of these funds have and will realize from investments in Groupon, Facebook, Twitter, Zynga, and other recent digital media IPOs.

My full spreadsheet of IRRs and multiples from these later round investments is here.  The returns in these late rounds are much better than you might think – except for that last round in Zynga which doesnt look so good right now.

So these firms did what any good investor would do – they leveraged (largely unrealized) momentum to raise mega funds when the wind was at their backs.  Yet another grand venture experiment in progress – one for which we won’t know the outcome for another 10 years.

Back to Fund Size – New Numbers

Now back to fund size – the existing analyses mentioned above all look at funds across the history of venture capital. The problem with this approach is that in the 1980s and 1990s, almost all funds were sub-$250M  – certainly all of the good ones.

That also means that the record breaking 20-30x (!) funds that Matrix, Sequoia, Benchmark, and Kleiner had in the mid-90s are part of this data above and probably move it quite a bit.

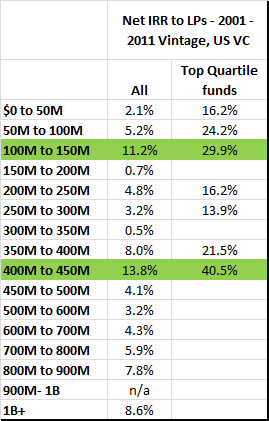
So what is the optimal fund size when focusing on funds from 2001-2011 vintages – looking solely at IRR – since some of these funds are still in the J-curve to look at DPI?

The results actually don’t change much – small is still beautiful – with a caveat that requires explaining.

Two fund size ranges emerge as the optimal based on this data set of several hundred funds.

$400-$450M AND $100-$150M – across all quartiles and the top quartile funds.

Bruce Booth wisely pointed out to me the following caution when looking at this data:

Since there are only 8 to 50 funds per sub-group in this data set, the outperformance (or underperformance) of one or two funds can move the needle for the group quite sigifigantly – and in the case of the $400-$450M range, Accel’s 2004 $400M fund that is currently rumored to be valued at 12.5x – largely due to Facebook’s 95% contribution to the TVPI of this fund – probably is moving the IRR needle quite a bit as well.

So with that caveat – I still stand by the rule that small is beautiful in venture – the recent mega-funds and the imperfect data above not withstanding.

Navin Chaddha from Mayfield put it best in a reccent interview in the WSJ:

“I believe that the VC asset class will continue to attract investment, but there will be a flight to quality, with both teams as well as track record playing significant roles. There will be the haves and the have-nots. Further, in the haves category, there will be a divergence between firms that opt to raise and deploy sub-$400 million funds into classic, early-stage companies and a few firms that will raise billion dollar-plus funds to continue a multi-stage, multi-sector (IT, digital media and health care) and multi-geography strategies all in one fund. “

But will the latter strategy actually pan out?

The historical data implies that it won’t.

Healthcare Venture’s Unrealized Problem

In healthcare on January 6, 2012 at 11:20 pm

Last summer, Bruce Booth and I wrote a paper in Nature Biotech examining the returns differences between healthcare and IT investments over the past decade.

What came as a surprise to many in the industry, including many LPs I have spoken to, was that healthcare venture investments have produced better realized returns for LPs over the past decade than IT investments have.

Let me say that again for those of you who didn’t see the paper: Healthcare investments outperformed IT investments over the past decade.

But the news wasn’t all good. In the accompanying blog post, Bruce and I touched on the fact that the data showed that the unrealized portfolio of active investments across all of healthcare venture is basically being carried at no mark-up whatsoever vs. a nice mark-up for IT investments that are still unrealized.

In that post, we explained the following:

 As we outline in our paper, significant mark-ups from round to round tend not to occur in LS companies. Instead, even well performing LS companies tend to be held at or near cost until an exit occurs leading to punitively low unrealized LS IRRs.  Tech companies that perform well, however, can get large round-to-round mark-ups – which helps significantly in driving the value of an unrealized Tech portfolio.

To put a fine point on the issue of the unrealized portfolio, I took a look at the same vintages from our data set (initial investments made by US VC firms into US companies between 2000-2010, updated to 6/30/2011 data) and this time focused on the carrying multiple of the unrealized investment (vs. the unrealized IRR which we studied in the paper and post last summer).

What is unrealized multiple?

Well, quite simply, it’s the value at which a particular investment round of capital is being carried at in a particular company. So if a first round is done where a VC invests $5M – then $5M is the cost basis.  If the company is marked-up by 2x at the second round, then that original $5M of cost will typically be marked-up carried at $10M by the initial VC.

Why is looking at unrealized data important in this context?

Well for one thing, according to VentureSource, there are 2,363 US-based healthcare companies that received venture financing from Jan 1, 2000 to present that are still privately held and in active operation.

Our collective hope as investors and entrepreneurs in healthcare ventures is that these 2,363 companies will perform just as well as the realized returns from the past decade and will continue to lead the pack vs. the benchmarks for venture  capital returns in other industries like IT and Software.

But the doom-and-gloom crowd, often led LPs who unrealistically pine for the once-in-a-lifetime heyday of the late 90s internet boom, clearly think that these 2,363 active healthcare companies will perform far worse than the already exited healthcare companies that have been proven to have returned a strong IRR in the past decade.

Why else would the pressure on healthcare venture be as great as it is these days? If the realized returns since the late-90s bubble have been better in healthcare than in IT, then only the perception of the quality of the unrealized portfolio would drive the fear of healthcare venture capital that is being seen these days.

And a cursory look at the data would reinforce this perception problem that healthcare venture has.

Indeed, almost 40% of medtech and biopharma investment rounds from the past decade are being carried at less than 1x today. And only 2% are being carried at 3x+.
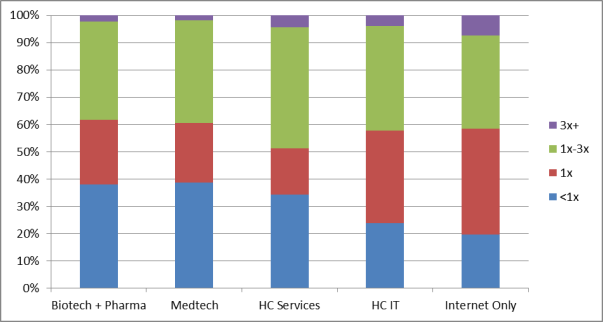
Compare that to the internet sub-sector of IT – which is the sub-sector that LPs and industry watchers mostly focus on.  For internet companies, only 20% of all investment rounds are being carried at less than 1x and a whopping 7% are being carried at 3x+ their original cost.

This disparity between sectors at the two ends of the returns curve is notable. We explored the reasons behind it in the article last summer – and capital efficiency clearly has alot to do with it. It’s harder to have marked up rounds when so much capital has to go into healthcare companies vs. tech companies.

But  there is more to it: interim milestones in healthcare companies just aren’t valued as much by outside firms as revenue or momentum growth is in tech and internet companies.

Making this worse is that as the healthcare venture ecosystem shrinks, there are less and less firms that are even able to lead follow-on rounds for companies – and reduced competition is a bad thing for both entrepreneurs and early stage investors alike who are left holding the bag or taking an “any-pre” round to get a company financed.

So, following Bruce’s lead, here is my glass half-full prediction for healthcare venture for the next decade:

Realized gross IRRs in healthcare will continue to be strong and consistent – as they have been for the past 3 decades. Probably in the 15%-20% range – perhaps even somewhat higher if an IPO market ever returns for venture-backed healthcare companies.

LPs will continue to make money investing in funds with healthcare exposure.  Pharma, medtech, and health insurers – all sitting on growing and massive mountains of cash –  must keep buying new companies to help their flat organic growth rates.

Now here is my glass-half empty prediction:

The unrealized problem will only grow worse.  There will be more ugly down rounds in healthcare. The unrealized IRR will go down further and the number of companies valued <1x will continue to increase.

“Vulture venture” investing will proliferate in healthcare. And it will be the longest buyer’s market we have seen in any sector of venture capital since the creation of the asset class. What we will have is a “name your price” market for many companies in many sub-sectors of healthcare for the next several years.

These flat and down rounds will exacerbate the patently incorrect perception in some circles that healthcare venture is in some way “damaged” – and it will particularly be so in diversified firms where internet partners will be the heroes for the next couple of years as the public markets absorb the high flying consumer internet companies of the past few years at huge gains to the small handful of VCs who invested in those companies.

Of course, there were some excesses in the 2006-2007 vintages in healthcare – too many early stage medtech and biopharma companies were likely funded in those two years – which probably explains why 2007 is only 1 of 2 vintage years since 1981 where investments in healthcare venture companies have a negative realized gross IRR.

But it’s important for everyone to focus on realized returns as the only barometer of the true health of a sector. While unrealized is interesting data – it probably over-estimates IT and Internet returns and under-estimates healthcare returns.

The NVCA and Cambridge Associates actually do LPs and the entire venture industry a dis-service by publishing aggregate realized+unrealized data when they put out their quarterly company level returns data by sector and not breaking out realized returns from unrealized data.

Headed into the 30th Annual JP Morgan Healthcare Conference – my 10th one in attendance, I am very hopeful about the future of healthcare venture.

Those with money and investment fortitude over the next few vintages will see continue to see some exceedingly strong realized returns.